Foundations with R three free courses

Learn data analysis by doing, in your browser.

Follow one realistic dataset from a raw table to a finished chart, across three short courses. Nothing to install.

Free to start no account needed progress saved in this browser

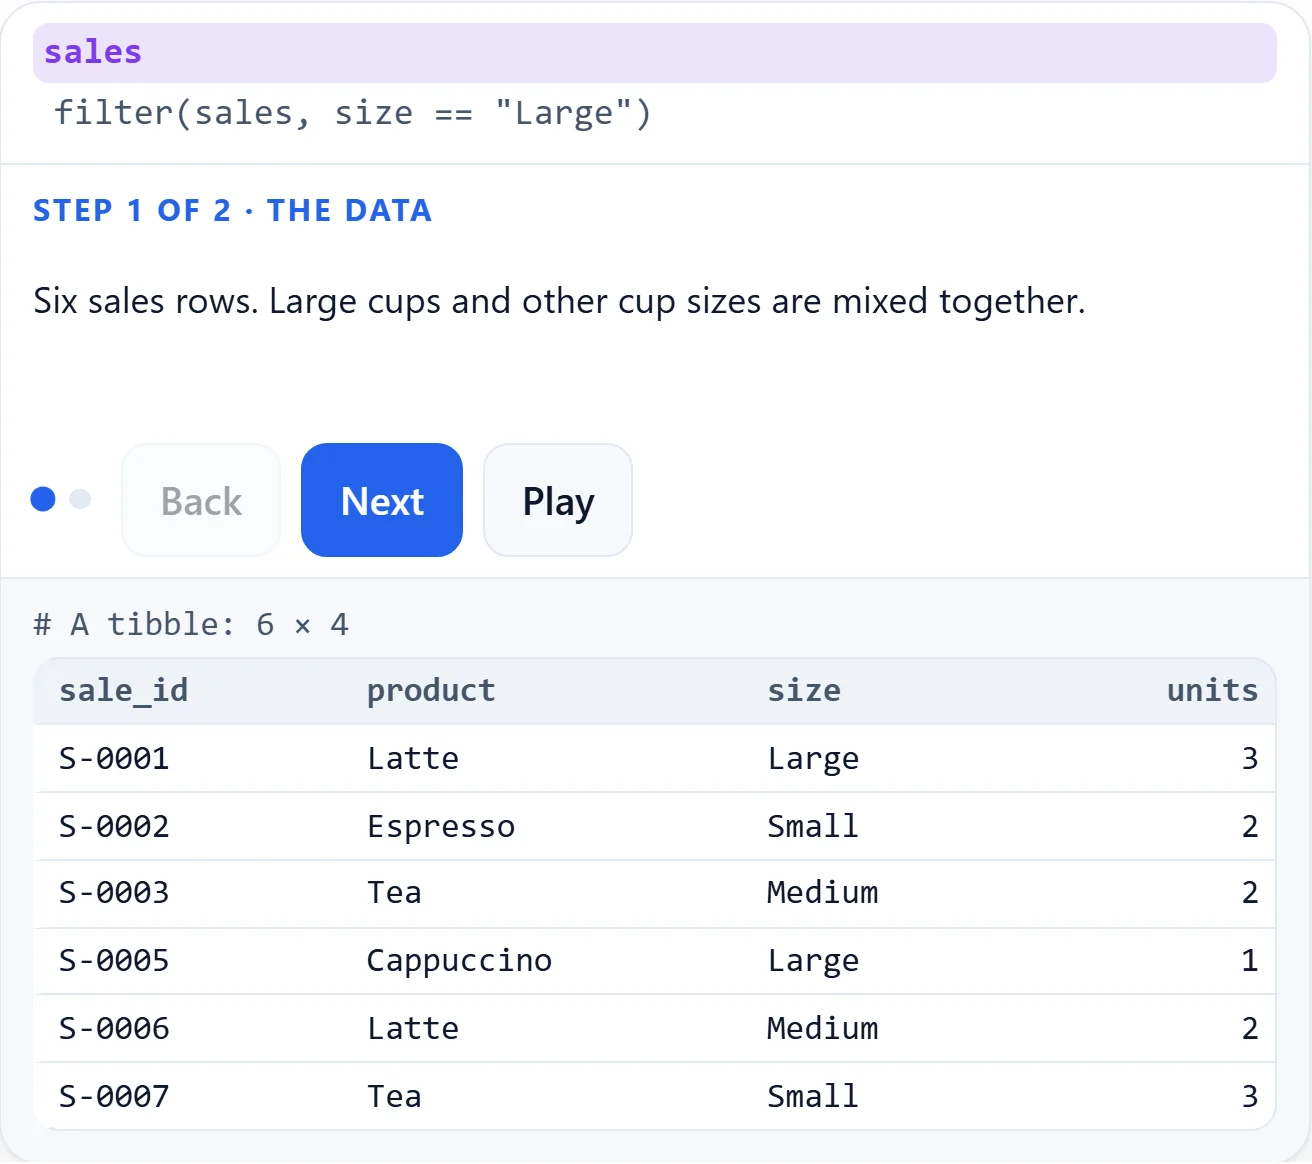
Inside a lesson · dplyrapp.rsquaredacademy.com
A real dplyr lesson: filter keeps the Large sales while the other rows fade away.
Watch filter() keep the rows that match. Open this lesson.

The learning experience

What's inside

Read a little. Try it. See what happens.

  • Illustration: three lines of R code, a Run button and a bar chart appearing below

    01 / In the browser

    R runs in your browser

    Write and run R beside the lesson. Nothing to install.

  • Illustration: a line of ggplot2 code with a highlighted blank and geom_col() filling it, above a bar chart

    02 / Guided practice

    Four page types

    Read and quiz / Fill the gaps / Fix the code / Write it yourself.

  • Illustration: R code that computes an average, with a green Correct banner explaining the result

    03 / Check your thinking

    Instant feedback

    See whether your answer is right and what to check next.

  • Illustration: a filter() call with a mistake, a Not yet message and a hint saying to use == to compare

    04 / A little help

    Hints, one at a time

    Ask for the next hint when you need a little guidance.

  • A step-through in three steps: a small table of products and sizes, the two Large rows highlighted by filter(size == "Large"), then only those two rows kept.

    05 / See the idea

    Step-through diagrams

    Follow each dplyr step as it changes the table.

  • The Datasets panel: sales.csv (160 rows, 7 columns) expanded to its first rows, with stores.csv (9 rows, 6 columns) below.

    06 / Know your data

    Datasets panel

    Keep the course datasets, columns and first rows beside your code.

Pick up where you left off. Progress is saved in this browser.

Foundations with R

One dataset. Three ways to work with it.

Start with your first line of R. Then turn the same Bean & Barrel data into clean tables and clear charts.

  1. citycountryrevenue_usdNairobiKenya1627.95LisbonPortugal701.69TorontoCanada1334.57VancouverCanada956.19BerlinGermany1050.51MontrealCanada1122.52
    Course 1Free

    Introduction to R

    Write your first R code: values, vectors, data frames and functions.

  2. countryrevenueCanada1137.76Germany839.05India1121.72Kenya1627.95Portugal701.69
    Course 2Free

    Data Wrangling with dplyr

    Filter, sort, summarise and join data with the dplyr verbs and the pipe.

  3. 05001,0001,500CanadaGermanyIndiaKenyaPortugal
    Course 3Free

    Data Viz with ggplot2

    Build clear charts layer by layer with ggplot2.

Free Intro to SQL and Intro to Python courses are coming soon. See all courses

How it works

A little reading.
A lot of doing.

Read a short lesson, write R in your browser and get instant feedback.

Each idea comes with a small, realistic dataset, explained in plain words. Find out straight away whether your answer is right, and what to fix if it isn't.

How you'll learn

Each lesson takes one idea and climbs four steps, from watching it done to doing it yourself.

How learning works here (1 min)

How learning works here (61 s)
  1. 1

    See it worked

    A short worked example shows the idea on the course data, with its answer.

  2. 2

    Fill in the blanks

    Complete a few missing pieces of working code.

  3. 3

    Fix the bug

    Find the mistake in code that does not work yet.

  4. 4

    Write it yourself

    Start from a blank script and answer a question with your own code.

Built by the author of olsrr, descriptr and rfm

Learn from an experienced data science consultant, author of popular R packages and eBooks

2.9 million downloads
  • olsrr R package logo
  • blorr R package logo
  • descriptr R package logo
  • inferr R package logo
  • vistributions R package logo
  • rbin R package logo
  • rfm R package logo
  • xplorerr R package logo
  • yahoofinancer R package logo
  • standby R package logo

CRAN downloads, all time, through .

Source: cranlogs download totals. Posit CRAN mirror only; other mirrors are not counted. Available logs start in October 2012. Downloads are not a count of people.

Explore our open-source work

6 public eBooks

  • Introduction to R eBook cover
  • Data Wrangling with R eBook cover
  • Data Visualization with ggplot2 eBook cover
  • R, Databases & SQL eBook cover
  • Command Line Basics for R Users eBook cover
  • Data Visualization with Base R eBook cover

Free to read online, from your first R code to wrangling, charts and SQL.

Browse the free eBooks
Coming 2027

Paid tracks coming in 2027

Data Analyst with R, Data Analyst with Python and SQL for Data Analysts. Each track builds on one realistic business dataset. See the full descriptions.